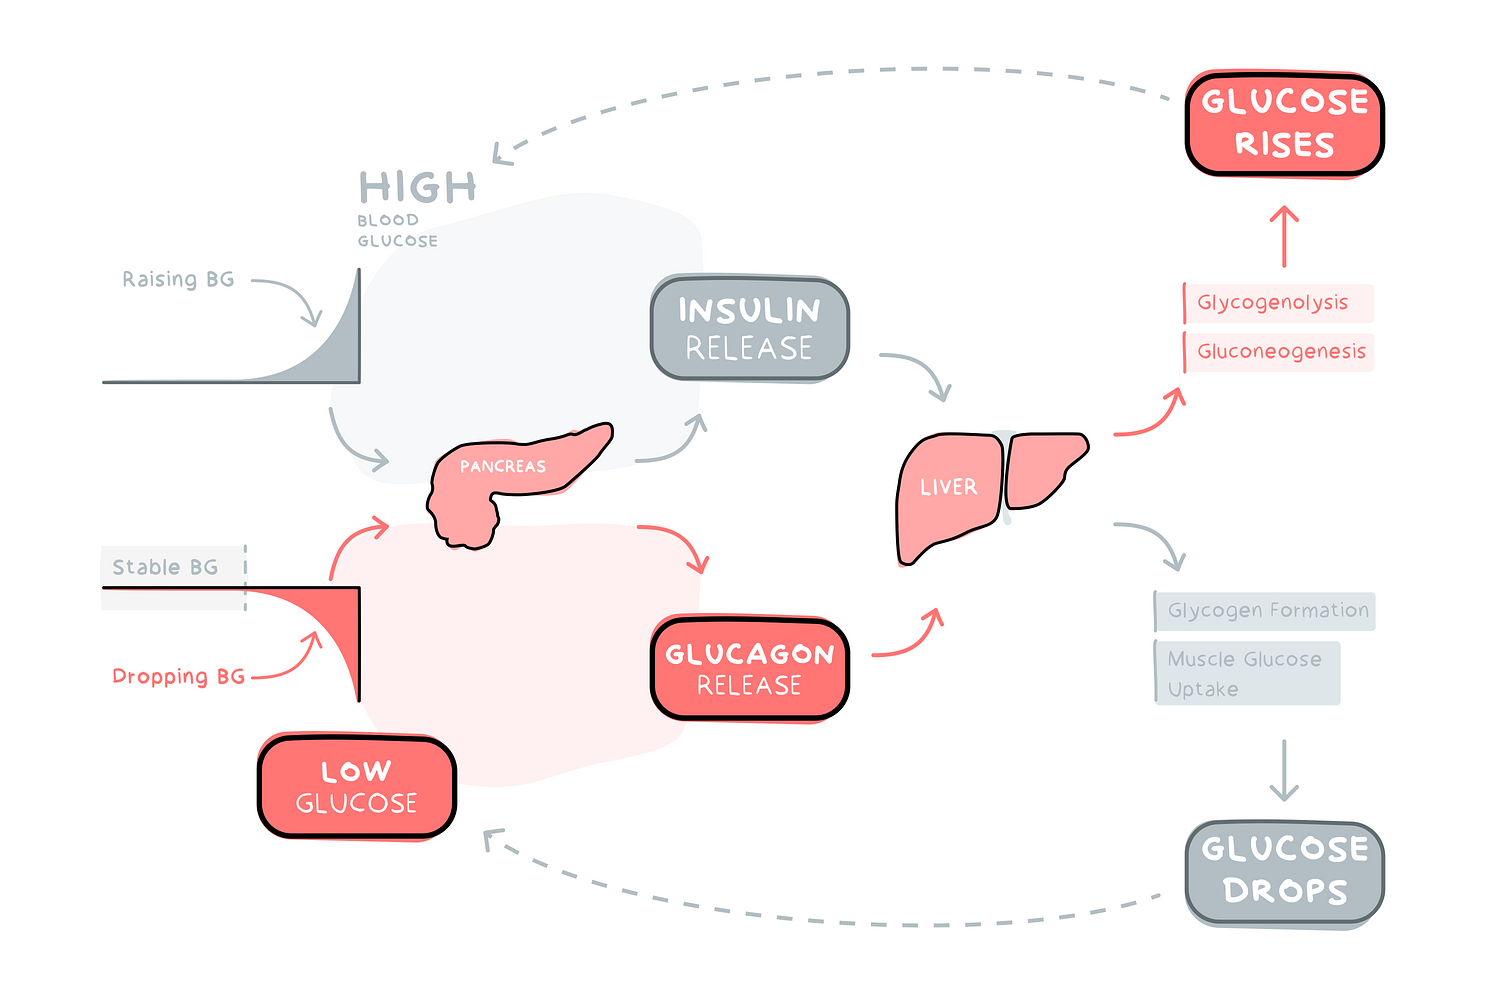
Figure 3b. Blood Glucose Homeostasis (in people without T1D). Normal blood glucose homeostasis is a feedback loop between insulin and glucagon, with the insulin-glucagon ratio varying inversely with the need for endogenous glucose production. These figures break down how glucose is regulated depending on blood sugar levels. Splitting the figure into two sections clarifies two distinct processes: a) insulin release when glucose is high and b) glucagon release when it’s low. By keeping the opposing process faintly present in the background, the design maintains focus on the current process but still hints that both mechanisms operate continuously.